Mambajao
Officially the Municipality of Mambajao, is a 3rd class municipality and capital of the province of Camiguin, Philippines. According to the 2020 census, it has a population of 41,094 people.
Cultural History
The name MAMBAJAO is believed to have come from two Cebuano-Visayan origins. One version is derived from the phrase “naay bahaw” or “there is a cooked rice leftover” and the other, and more popularly known, is from the word “mamahaw”, meaning “ tohave breakfast”.
When the early Spanish colonizers arrived in the island of Camiguin, they named the town “mamahaw” and later became what is called today as “Mambajao”. Mambajao was founded as a town and parish on July 6, 1855 with Señor Don Froilan Basa as the first Governadorcillo and Fr. Valero Salvo de San Sebastian as the parish priest. Nine barangays were created Agoho to Tupsan.
The eruption of Mt. Vulcan-Daan that caused the total destruction and sinking of the town proper of Guiob-Catagman forced its residents to migrate to new settlements in Mambajao. This in turn created the socio-economic and population growth to over 11,000 of the town by the end of the century.
When Camiguin Island was elevated to a province by virtue of Republic Act 4669, Mambajao became its capital town. Abaca industry boomed after the May 1, 1871 eruption of Mt. Vulcan that later paved Mambajao to become as an abaca port in Northern Mindanao. In 1888, steamers carried more than P400,000 worth of abaca to Cebu and Manila every four days making it the town’s major economy.
On November 21, 1901, the American conquerors landed at Cabuan beach. Some locals known as “los libertadores” (youth volunteer defenders) fought against the Americans which resulted to a battle that drove the invaders to sail away. However, after the capture of Gen. Aguinaldo, the local officials decided to surrender the town to the Americans. Public education and local water systems were opened the following year.
In 1911, House Speaker Osmeña inaugurated the Rizal monument and the public elementary school building of Mambajao. In that same year, William Cameron Forbes visited Mambajao where he landed the first automobile ever to come to Mindanao.
In 1924, Doña Agustina Borromeo founded the Academy of Our Lady which was managed later on by the Benedictine German sisters.
After World War II the management of the academy was returned to laymen’s administration. The former principal was Ms. Asuncion B. Cagulada, now a religious sister named Madre Asuncion, R.V.M. Camiguin Institute became the first catholic high school in Mambajao and in the entire Camiguin.
On June 16, 1942, the Japanese army arrived and established its local government in the Municipality. They did not stay long but came back after hearing of the Camiguingnons’ guerrilla military plan. As a result of the Japanese and guerrilla encounter, the town was burned by the Japanese army completely destroying sixty seven Spanish built houses, the Municipal Hall and the Catholic Parish Convent.
Finally, Mambajao regained its freedom from the Americans on February 2, 1944.
On September 1, 1948, Mount Hibok-Hibok erupted for the first time killing people in the upland villages. It exploded again in September 14, 1949 burning to death 79 persons in Baylao, Agoho and Mambajao.
On December 4, 1951 was Mount Hibok-Hibok’s third and most terrifying eruption that ever occurred in Camiguin where more than 1000 persons perished under rolling balls of fire that damaged almost 8 square kilometers of coconut land. Mambajao then became a ghost town and the seat of local government was transferred to Barangay Tupsan. During this period Camiguin belonged to the Province of Misamis Oriental.
On January 2, 1957, Camiguin Island was inaugurated as a sub-province with Dr. Jose P. Neri as its first Lieutenant Governor and Mambajao as its capital town.
Today, Mambajao has emerged as the most economically and politically significant town in Camiguin being the hub of provincial governance, education, trade, business and tourism.

Mambajeños were able to put up for the first time its potable water system for the whole town in 1903. The stone construction of San Nicolas de Tolentino Church soon followed and was completed in 1936. The projects were financed by the wealthy families of the town.
In 1908, Speaker Sergio Osmeña of the first Philippine Assembly, together with Secretary Dionisio Jakosalem of the Ministry of Agriculture came to Mambajao. In 1909, Ms. Ruth Forbes with her son visited Mambajao as the personal house guests of the Reyes family. Ms. Forbes acted as sponsor in the laying of the stone foundation of Rizal monument, incidentally the tallest Rizal monument in the country today.
In 1911, House Speaker Osmeña inaugurated the Rizal monument and the public elementary school building of Mambajao. In that same year, William Cameron Forbes visited Mambajao where he landed the first automobile ever to come to Mindanao.
In 1924, Doña Agustina Borromeo founded the Academy of Our Lady which was managed later on by the Benedictine German sisters.
After World War II the management of the academy was returned to laymen’s administration. The former principal was Ms. Asuncion B. Cagulada, now a religious sister named Madre Asuncion, R.V.M. Camiguin Institute became the first catholic high school in Mambajao and in the entire Camiguin.
On June 16, 1942, the Japanese army arrived and established its local government in the Municipality. They did not stay long but came back after hearing of the Camiguingnons’ guerrilla military plan. As a result of the Japanese and guerrilla encounter, the town was burned by the Japanese army completely destroying sixty seven Spanish built houses, the Municipal Hall and the Catholic Parish Convent.
Finally, Mambajao regained its freedom from the Americans on February 2, 1944.
On September 1, 1948, Mount Hibok-Hibok erupted for the first time killing people in the upland villages. It exploded again in September 14, 1949 burning to death 79 persons in Baylao, Agoho and Mambajao.
On December 4, 1951 was Mount Hibok-Hibok’s third and most terrifying eruption that ever occurred in Camiguin where more than 1000 persons perished under rolling balls of fire that damaged almost 8 square kilometers of coconut land. Mambajao then became a ghost town and the seat of local government was transferred to Barangay Tupsan. During this period Camiguin belonged to the Province of Misamis Oriental.
On January 2, 1957, Camiguin Island was inaugurated as a sub-province with Dr. Jose P. Neri as its first Lieutenant Governor and Mambajao as its capital town.
Today, Mambajao has emerged as the most economically and politically significant town in Camiguin being the hub of provincial governance, education, trade, business and tourism.
MISSION
VISION
CORE VALUES
List of Elected and Appointed Mayors
A. Spanish Period
| 1855 - 1857 | Froilan Basa |
| 1857 - 1860 | Juan Biyok |
| 1860 - 1861 | Pablo Palarca |
| 1861 - 1864 | Vicente Maestrado |
| 1864 - 1867 | Mariano Ebarle |
| 1867 - 1869 | Hilario Ebarle |
| 1869 - 1871 | Placido Reyes |
| 1871 - 1873 | Ambrosio Borromeo |
| 1873 - 1876 | Isidoro Aranas |
| 1876 - 1879 | Felino Aranas |
| 1879 - 1885 | Estaquio Nery |
| 1885 - 1890 | Hermogenes Ebarle |
| 1890 - 1894 | Lucio Borromeo |
| 1894 - 1896 | Francisco Nery |
| 1896 - 1898 | Ciriaco Maestrado (last Gobernadorcillo) |
B. American Period
| 1898 - 1900 | Severino Reyes |
| 1900 - 1912 | Ricardo Reyes |
| 1912 - 1916 | Felino Aranas |
| 1917 - 1921 | Carlos Corraleso |
| 1922 - 1926 | Macario Cainglet |
| 1926 - 1935 | Leon Borromeo |
| 1936 - 1946 | Jorge Ebarle |
C. Philippine Government
| 1946 - 1951 | Meliton Limbaco, Sr. |
| 1951 - 1952 | Jesus B. Neri |
| 1952 - 1955 | Pio P. Cagmat |
| 1955 - 1961 | Sergio Lactao |
| 1961 - 1968 | Antonio R. Luspot |
| 1968 - 1971 | Atty. Julio A. Vivares |
| 1971 - 1972 | Atty. Marciano Ll. Aparte, Jr. |
| 1972 - 1980 | Isidra E. Neri |
| 1980 - 1986 | Nicolas E. Neri |
| 1986 - 1987 | Araceli M. Romualdo |
| 1987 - 1987 | Gil G. Fabe |
| 1987 - 1998 | Araceli M. Romualdo |
| 1998 - 2001 | Isidro T. Reyes |
| 2001 - 2007 | Noordin Efigenio M. Romualdo |
| 2007 - 2016 | Ma. Luisa D. Romualdo |
| 2016 - 2019 | Jurdin Jesus M. Romualdo |
| 2019 - Present | Yñigo Jesus D. Romualdo |
Demographics
FACTS AND FIGURES
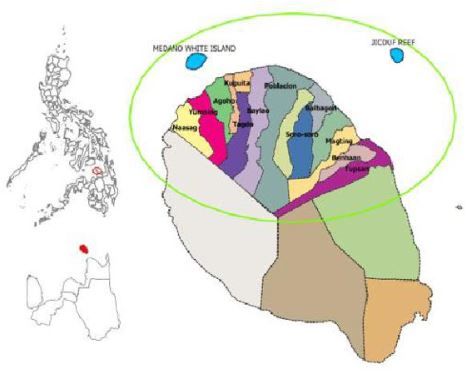
The Municipality of Mambajao is located in the northernmost part of Camiguin Island. It lies within the geographic coordinates 9°12’ latitude, 124°42’ longitude. It is bounded on the north by Mindanao Sea; on the east by Bohol Sea; on the west by Mindanao Sea and the Municipality of Catarman; on the south by the municipalities of Sagay and Mahinog.
Figure 1 – Mambajao Map
The town proper is about seventeen (17) kilometers away from the port of Benoni in the Municipality of Mahinog. Mambajao is accessible by land, air and sea. From Cebu, it is about nine (9) hours travel by boat via the Port of Balbagon and only twenty (20 )minutes by plane. The municipality is about 5 hours sailing time by ferry from Jagna, Bohol to the Port of Balbagon. It takes about one hour and fifteen minutes from the Port of Balingoan, Misamis
Oriental to cross the channel between mainland Mindanao and the island of
Camiguin.
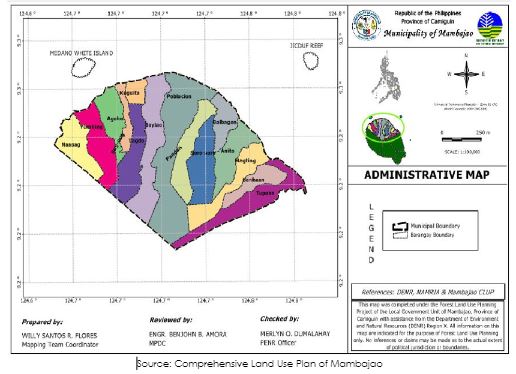
The Municipality of Mambajao has a land area of 89.00 square kilometers or 34.36 square miles which constitutes 37.40 % of Camiguin’s total land area.Mambajao is politically subdivided into fifteen (15) barangays. Eleven (11) barangays are coastal and four (4) are upland. Poblacion is the biggest in terms of land area (18.28%) with a population (29.41%) while Kuguita is the smallest (1.79%) in land area followed by Bug-ong.
Table 1 – Land Area by Barangay, 2011
Barangay | Area (Has.) | Percent (%) |
URBAN: Poblacion | 1,627 | 18.28 |
URBANIZING: Yumbing Bug-ong Balbagon Anito Tupsan Agoho | 602 200 389 521 752 437 | 6.76 2.25 4.23 5.85 8.45 4.91 |
RURAL: Benhaan Kuguita Magting Naasag Pandan Soro-soro Tagdo Baylao | 351 160 503 500 567 707 619 956 | 3.95 1.79 5.65 5.62 6.37 7.94 6.96 10.84 |
TOTAL | 8,900 | 100 |
Source: 2011 Comprehensive Master Plan for the Province of Camiguin
Figure 2 - Administrative Map
Population
Historical Growth of Population
For eleven (11) censal periods, from 1093 to 2015 the population of the Municipality steadily registered a 2 percent growth rate every ten (10) years or a 1 percent average growth rate every five (5) years. It was only during the Mt. Hibok-Hibok eruption when the Municipality registered a significant negative
rate of 4.08 percent when the locals migrated to the mainland and to Bohol.
Table 2 – Historical Growth of the Population, 1903-2015
Censal Year | Population | Increase/ (Decrease) | Ave. Growth Rate |
1903 | 14,446 | – | – |
1918 | 21,308 | 6,862 | 2.62 |
1939 | 21,414 | 106 | 0.02 |
1948 | 25,193 | 3,779 | 1.82 |
1960 | 15,288 | (9,905) | (4.08) |
1970 | 18,673 | 3,385 | 2.02 |
1975 | 19,243 | 570 | 0.54 |
1980 | 21,337 | 2,094 | 2.15 |
1990 | 25,207 | 3,870 | 1.68 |
1995 | 27,770 | 2,563 | 1.83 |
2000 | 30,806 | 3,036 | 2.25 |
2007 | 35,308 | 4,502 | 1.90 |
2010 | 36,435 | 1,127 | 1.15 |
2015 | 38,735 | 2,300 | 1.17 |
Source: NSO 2015 Data (Wikipedia)
Population by Barangay
All the fifteen (15) barangays registered positive growth rates with the urban (Poblacion) and the six (6) urbanizing barangays (Agoho, Anito, Balbagon,
Bug-ong, Tupsan and Yumbing) getting 63.56% of the population and the remaining 36.44% shared by the eight (8) rural barangays.
Table 3 – Comparative Population by Urban-Rural, 2010-2015
Barangay | Population Percentage (2015) | Population (2015) | Population (2010) | Change (2010-2015) | Annual Population Growth Rate (2010-2015) |
URBAN | |||||
Poblacion | 27.42% | 10,623 | 10,330 | 2.84% | 0.53% |
URBANIZING | |||||
Agoho | 6.69% | 2,593 | 2,374 | 9.22% | 1.69% |
Anito | 4.26% | 1,650 | 1,593 | 3.58% | 0.67% |
Balbagon | 7.20% | 2,790 | 2,606 | 7.06% | 1.31% |
Bug-ong | 3.21% | 1,244 | 1,158 | 7.43% | 1.37% |
Tupsan | 6.76% | 2,619 | 2,455 | 6.68% | 1.24% |
Yumbing | 8.02% | 3,107 | 2,969 | 4.65% | 0.87% |
RURAL | |||||
Baylao | 6.90% | 2,673 | 2,151 | 24.27% | 4.22% |
Benhaan | 2.79% | 1,081 | 1,020 | 5.98% | 1.11% |
Kuguita | 3.05% | 1,183 | 1,127 | 4.97% | 0.93% |
Magting | 5.39% | 2,089 | 1,980 | 5.51% | 1.03% |
Naasag | 4.29% | 1,663 | 1,544 | 7.71% | 1.42% |
Pandan | 7.63% | 2,957 | 2,731 | 8.28% | 1.53% |
Soro-soro | 2.81% | 1,089 | 1,039 | 4.81% | 0.90% |
Tagdo | 3.55% | 1,374 | 1,358 | 1.18% | 0.22% |
Mambajao Total | 38,735 | 36,435 | 6.31% | 1.17% | |
Source : PSA 2010 and 2015
The first three (3) barangays with the biggest population increase within seven (7) years are Baylao with 24.27% change in population, where the location of
the province airport is located and where there is high economic activity in the area. Followed by Agoho with 9.22% change. Agoho is one of the identified BAY (Bug-ong-Agoho-Yumbing) areas and as high-density tourism zone. Pandan with 8.28% change in population, highlighting BLISS (Bagong Lipunan Improvement of Sites and Services) that is located in this barangay.
With the average growth rate from year 2010-2015 of 1.17, it is projected that population distribution in the already populated areas will continue, except in those areas of the barangays which are identified as high risk areas for disasters.
Population by Age Group
According to the 2015 Census, the age group with the highest population in Mambajao is 5 to 9, with 4,070 individuals. Conversely, the age group with the lowest population is 80 and over, with 482 individuals.
Combining age groups together, those aged 14 and below, consisting of the young dependent population which include infants/babies, children and young adolescents/teenagers, make up an aggregate of 31.55% (12,221). Those aged 15 up to 64, roughly, the economically active population and actual or potential members of the work force, constitute a total of 61.61% (23,864). Finally, old dependent population consisting of the senior citizens, those aged 65 and over, total 6.84% (2,650) in all.
The computed Age Dependency Ratios mean that among the population of Mambajao, there are 51 youth dependents to every 100 of the working age population; there are 11 aged/senior citizens to every 100 of the working population; and overall, there are 62 dependents (young and old-age) to every 100 of the working population.
The median age of 25 indicates that half of the entire population of Mambajao are aged less than 25 and the other half are over the age of 25.
Youth Dependency Ratio: 51.21 – Old Age Dependency Ratio: 11.10
Total Dependency Ratio: 62.32 – Median Age: 25.06
Table 4 – Comparative Population by age group 2010-2015
AGE GROUP | 2010 | 2015 | ||||
TOTAL | MALE | FEMALE | TOTAL | MALE | FEMALE | |
Under 1 | 792 | 371 | 421 | 786 | 443 | 343 |
1 – 4 | 3,034 | 1,552 | 1,482 | 3,313 | 1,733 | 1,580 |
5 – 9 | 4,064 | 2,097 | 1,967 | 4,070 | 2,084 | 1,986 |
10 – 14 | 4,003 | 1,990 | 2,013 | 4,052 | 2,099 | 1,953 |
15 – 19 | 3,950 | 2,010 | 1,940 | 3,764 | 1,892 | 1,872 |
20 – 24 | 3,018 | 1,637 | 1,381 | 3,352 | 1,690 | 1,662 |
25 – 29 | 2,495 | 1,297 | 1,198 | 2,753 | 1,465 | 1,288 |
30 – 34 | 2,412 | 1,208 | 1,204 | 2,542 | 1,305 | 1,237 |
35 – 39 | 2,246 | 1,138 | 1,108 | 2,397 | 1,239 | 1,158 |
40 – 44 | 2,158 | 1,072 | 1,086 | 2,253 | 1,141 | 1,112 |
45 – 49 | 2,031 | 1,060 | 971 | 2,161 | 1,102 | 1,059 |
50 – 54 | 1,575 | 808 | 767 | 1,924 | 1,007 | 917 |
55 – 59 | 1,288 | 634 | 654 | 1,502 | 740 | 762 |
60 – 64 | 1,023 | 509 | 514 | 1,216 | 612 | 604 |
65 – 69 | 836 | 391 | 445 | 939 | 465 | 474 |
70 – 74 | 621 | 258 | 363 | 708 | 313 | 395 |
75 – 79 | 434 | 174 | 260 | 521 | 213 | 308 |
80 years and over | 384 | 137 | 247 | 482 | 158 | 324 |
TOTAL | 36,364 | 18,343 | 18,021 | 38,735 | 19,701 | 19,034 |
Table 5: School- Age Population, 2015
School-age Group | Population | Percent Total |
Pre-School ( 4-5 yrs. Old) | 914 | 3.75% |
Special Education | 26 | 0.11% |
Elementary (6-11 yrs. Old) | 10558 | 43.35% |
High School ( 12-16 yrs. Old) | 11987 | 49.22% |
Post-Secondary (17-21 yrs. Old) | 870 | 3.57% |
TOTAL | 24,355 | 100.00% |
Population Density
Based on the Table below, Barangay Poblacion has the biggest population with a total number of 10,623 individuals (PSA, 2015), followed by Barangay Yumbing which comprises 3,107 while the smallest populated barangay is Benhaan with a total number of 1,081. However in terms of population density Barangay Balbagon has 8.40 persons per hectare. This is due to the location of Camiguin Polytechnic State College where students from different municipalities and some are from other places live.
Table 6 – Population and Population Density by Barangay, 2015
Barangays | Number of Household (CBMS 2015) | Land Area (Has.) | Population (PSA 2015) | Density (Persons/Ha.) |
URBAN | ||||
Poblacion | 1,964 | 1,627.06 | 10,623 | 6.53 |
URBANIZING | ||||
Anito | 348 | 521.03 | 1,650 | 3.17 |
Agoho | 583 | 437.74 | 2,593 | 5.92 |
Balbagon | 631 | 332.22 | 2,790 | 8.40 |
Bug-ong | 260 | 200.44 | 1,244 | 6.21 |
Tupsan | 513 | 757.74 | 2,619 | 3.46 |
Yumbing | 724 | 601.68 | 3,107 | 5.16 |
RURAL | ||||
Baylao | 665 | 964.23 | 2,673 | 2.77 |
Benhaan | 182 | 351.22 | 1,081 | 3.08 |
Kuguita | 212 | 160.43 | 1,183 | 7.37 |
Magting | 446 | 601.74 | 2,089 | 3.47 |
Naasag | 295 | 500.22 | 1,663 | 3.32 |
Pandan | 552 | 566.35 | 2,957 | 5.22 |
Soro-soro | 158 | 637.92 | 1,089 | 1.71 |
Tagdo | 270 | 619.34 | 1,374 | 2.22 |
TOTAL | 7,803 | 8,879.36 | 38,735 | 4.36 |
Source: CBMS 2015, PSA 2015 and GIS generated data
Table 7 – Projected Population by Barangay 2015-2027
Barangays | Population(PSA 2015) | 2016 | 2017 | 2018 | 2019 | 2020 | 2021 | 2022 | 2023 | 2024 | 2025 | 2026 | 2027 |
URBAN | |||||||||||||
Poblacion | 10,623 | 10,747 | 10,873 | 11,000 | 11,129 | 11,259 | 11,391 | 11,524 | 11,659 | 11,795 | 11,933 | 12,073 | 12,214 |
URBANIZING | |||||||||||||
Anito | 1,650 | 1,669 | 1,689 | 1,709 | 1,729 | 1,749 | 1,769 | 1,790 | 1,811 | 1,832 | 1,854 | 1,875 | 1,897 |
Agoho | 2,593 | 2,623 | 2,654 | 2,685 | 2,716 | 2,748 | 2,780 | 2,813 | 2,846 | 2,879 | 2,913 | 2,947 | 2,981 |
Balbagon | 2,790 | 2,823 | 2,856 | 2,889 | 2,923 | 2,957 | 2,992 | 3,027 | 3,062 | 3,098 | 3,134 | 3,171 | 3,208 |
Bug-ong | 1,244 | 1,259 | 1,273 | 1,288 | 1,303 | 1,318 | 1,334 | 1,350 | 1,365 | 1,381 | 1,397 | 1,414 | 1,430 |
Tupsan | 2,619 | 2,650 | 2,681 | 2,712 | 2,744 | 2,776 | 2,808 | 2,841 | 2,874 | 2,908 | 2,942 | 2,976 | 3,011 |
Yumbing | 3,107 | 3,143 | 3,180 | 3,217 | 3,255 | 3,293 | 3,332 | 3,371 | 3,410 | 3,450 | 3,490 | 3,531 | 3,572 |
RURAL | |||||||||||||
Baylao | 2,673 | 2,704 | 2,736 | 2,768 | 2,800 | 2,833 | 2,866 | 2,900 | 2,934 | 2,968 | 3,003 | 3,038 | 3,073 |
Benhaan | 1,081 | 1,094 | 1,106 | 1,119 | 1,132 | 1,146 | 1,159 | 1,173 | 1,186 | 1,200 | 1,214 | 1,229 | 1,243 |
Kuguita | 1,183 | 1,197 | 1,211 | 1,225 | 1,239 | 1,254 | 1,269 | 1,283 | 1,298 | 1,314 | 1,329 | 1,344 | 1,360 |
Magting | 2,089 | 2,113 | 2,138 | 2,163 | 2,188 | 2,214 | 2,240 | 2,266 | 2,293 | 2,320 | 2,347 | 2,374 | 2,402 |
Naasag | 1,663 | 1,682 | 1,702 | 1,722 | 1,742 | 1,763 | 1,783 | 1,804 | 1,825 | 1,847 | 1,868 | 1,890 | 1,912 |
Pandan | 2,957 | 2,992 | 3,027 | 3,062 | 3,098 | 3,134 | 3,171 | 3,208 | 3,245 | 3,283 | 3,322 | 3,361 | 3,400 |
Soro-soro | 1,089 | 1,102 | 1,115 | 1,128 | 1,141 | 1,154 | 1,168 | 1,181 | 1,195 | 1,209 | 1,223 | 1,238 | 1,252 |
Tagdo | 1,374 | 1,390 | 1,406 | 1,423 | 1,439 | 1,456 | 1,473 | 1,491 | 1,508 | 1,526 | 1,543 | 1,562 | 1,580 |
TOTAL | 38,735 | 39,188 | 39,647 | 40,111 | 40,580 | 41,055 | 41,535 | 42,021 | 42,513 | 43,010 | 43,513 | 44,022 | 44,537 |
Source: Comprehensive Land Use of Mambajao
Topography and Slope
Topography
Mambajao has a rugged topography and is shaped like an open fan. The elevation is categorized into four, based on its range from less than 100, 100
to 500, 500 to 1,000 and above 1,000 meters above sea level (masl). Mambajao has 29.82% of land area with an elevation of less than 100
masl covering all fifteen barangays. 36.45% are ranging from 100-500 masl, 25.86% 500-1,000 masl and the remaining 7.87% are land areas with elevations of more than 1,000 masl.
Figure 3 – Elevation Map
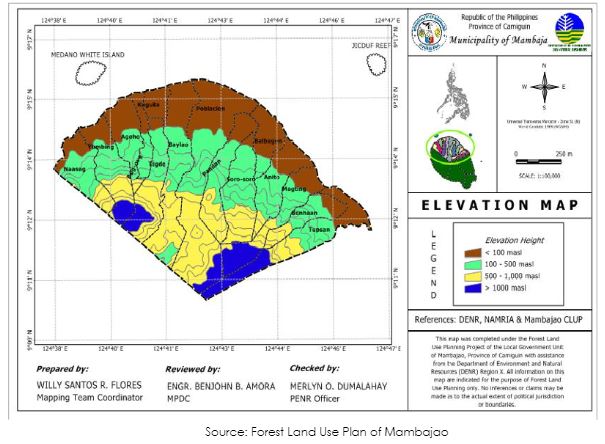
Table 8 – Elevation by Barangay
Barangay | Elevation [Meters Above Sea Level (masl)] | Grand Total | |||
< 100 | 100 – 500 | 500-100 | > 1,000 | ||
Agoho | 228.23 | 185.22 | 24.29 | 437.74 | |
Anito | 205.18 | 272.65 | 43.19 | 521.02 | |
Balbagon | 271.45 | 60.77 | 332.22 | ||
Baylao | 271.37 | 344.79 | 348.06 | 964.22 | |
Benhaan | 88.98 | 173.65 | 88.74 | 0.12 | 351.49 |
Bug-ong | 86.38 | 114.04 | 200.42 | ||
Kuguita | 160.42 | 160.42 | |||
Magting | 136.25 | 181.71 | 93.99 | 189.8 | 601.75 |
Naasag | 128.32 | 274.56 | 94.43 | 2.73 | 500.04 |
Pandan | 131.28 | 227.65 | 207.43 | 566.36 | |
Poblacion | 543.61 | 373.14 | 599.8 | 110.49 | 1,627.04 |
Soro-soro | 26.02 | 380.66 | 227.83 | 3.41 | 637.94 |
Tagdo | 40.33 | 201.02 | 277.48 | 100.47 | 619.30 |
Tupsan | 197.02 | 216.91 | 141.89 | 202.21 | 758.03 |
Yumbing | 133.19 | 229.67 | 149.56 | 89.28 | 601.68 |
Total | 2,648.03 | 3,236.44 | 2,296.69 | 698.51 | 8,879.36 |
Percentage (%) | 29.82 | 36.45 | 25.86 | 7.87 | 100% |
Source: GIS derived Data (Layover of Administrative & Elevation Maps)
Slope
Slope is a physical land characteristic that influences the susceptibility of the soil to erode, rainfall infiltration and ultimately the use of land. The Municipality of Mambajao has 34.68% of land area that ranges from level to nearly level (0-3%), 18.80% of the land area ranges from gently sloping to undulating (38%), 10.21% undulating to rolling (8-18%), 8.58% rolling to moderately steep (18-30%) and 27.71% of the land area is steep (30-50%).
Figure 4 – Slope Map of Mambajao
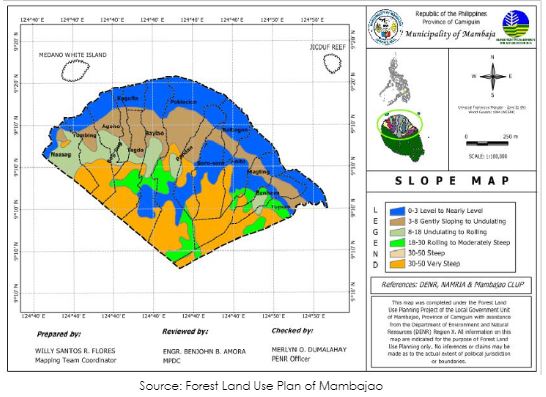
Table 9 – Slope by Barangay
Barangay | 0 to 3% | 3 to 8% | 8 to 18% | 18 to 30% | 30 to 50% | Grand Total |
Level to Nearly Level | Gently Sloping to Undulating | Undulating to Rolling | Rolling to Moderately Steep | Steep | ||
Agoho | 158.33 | 142.17 | 118.57 | 18.67 | 437.74 | |
Anito | 337.18 | 57.15 | 26.22 | 100.48 | 521.03 | |
Balbagon | 267.69 | 64.53 | 332.22 | |||
Baylao | 373.08 | 196.25 | 132.86 | 59.36 | 202.90 | 964.45 |
Benhaan | 95.53 | 98.89 | 45.80 | 52.06 | 59.22 | 351.50 |
Bug-ong | 53.86 | 85.03 | 61.16 | 0.39 | 200.44 | |
Kuguita | 146.98 | 13.45 | 160.43 | |||
Magting | 191.76 | 80.31 | 1.88 | 67.39 | 260.40 | 601.74 |
Naasag | 82.85 | 30.34 | 264.40 | 122.46 | 500.05 | |
Pandan | 225.94 | 175.82 | 12.11 | 10.41 | 142.07 | 566.35 |
Poblacion | 533.31 | 340.06 | 62.49 | 273.09 | 418.10 | 1,627.05 |
Soro-soro | 286.00 | 55.04 | – | 296.88 | 637.92 | |
Tagdo | 7.24 | 188.11 | 42.67 | 103.67 | 277.60 | 619.29 |
Tupsan | 206.47 | 48.27 | 14.89 | 161.11 | 327.04 | 757.78 |
Yumbing | 113.91 | 94.50 | 150.21 | 8.68 | 234.38 | 601.68 |
Total | 3,080.13 | 1,669.92 | 907.04 | 761.99 | 2,460.59 | 8,879.36 |
Percentage (%) | 34.68 | 18.80 | 10.21 | 8.58 | 27.71 | 100.00 |
Source: GIS derived data (Layover of Administrative & Slope Maps)
Geology
Soil Type
Basic Life SuppThere are five soil types found in Mambajao. The most dominant type is the undifferentiated mountain soils found on the pyroclastic hills at the center of the municipality extending towards its southern boundary and within the vicinity of the volcanic mountains. It covers 49.37 percent of the total municipal land area. The vegetative cover of this area is generally forest patches of grasslands. Erosion ranges from slight to severe, especially on the western
part. These areas have no immediate agricultural value and are suitable for forest uses. The second dominant type of soil covering 29.11 percent is Camiguin clay. This is principally located in the pyroclastic hills extending from
east to west. Severe erosion has been observed in the eastern part. Its present vegetation are coconuts, forest, shrubs and diversified crops. This type of soil is suitable for permanent crops such as fruit trees and coconuts due to the presence of rock outcrops. It can also be used as pastureland. Soil management measures have to focus on the prevention on
soil erosion and the maintenance of soil productivity. Next to Camiguin clay is
Mambajao clay which covers 15.94% of the total municipal land area. This type is also found on the pyroclastic hills next to Camiguin clay, extending from east to west but towards the northern portion of the municipality. Slight erosion has been observed in most parts of the area. Its current vegetations are coconuts and associated paddy rice, banana, lanzones and other fruit trees, grasses and shrubs. This type of soil is suitable for all indigenous crops most especially coconuts, corn, rice, banana and abaca.
The northernmost part of the municipality has two (2) types of soil; beach sand and San Manuel Loam. The coastal type forms the outer ring of the town covering 2.94 percent but has no agricultural value. The other type, the San Manuel Loam is found in flat to nearly level areas along the coastal plain. This is usually utilized for rice production. It is also easy to manage and does not pose any erosion problem. ort Extricatio
Soil depth is classified as follows:
- a) Shallow – less that 50 centimeters deep
- b) Moderately Deep – 50 to 100 centimeters deep
- c) Deep to Very Deep – more that 100 centimeters deep
Based on this classification, majority of the soil in Mambajao are deep to very deep due to the very thick deposition of pyroclastic materials and intense weathering that have produced deep profiles even on relatively steep slopes. Shallow soils comprise the minority and are found on rocky and
miscellaneous soil types. The inherent fertility of the soil in the island is
assessed by the Bureau of Soils and Water Management using sufficient samples from representative sites. Assessment is based on various factors such as soil acidity, organic matter content, available phosphorus and potassium, base saturation and cation exchange capacity. Like the rest of the
province, Mambajao’s soils have medium to high fertility and are slightly acidic. The main agricultural areas devoted to rice has high organic matter, available
phosphorus and potassium contents. The broad alluvial plain area is not well drained due to its low physiographic position. Although this area is devoted to rice which can tolerate poorly drained soils.
Table 10: Land Area by Soil in Mambajao, 1996
Soil Classification | Area (Has.) | Percent |
Beach Sand | 262.00 | 2.94 |
San Manuel Loam | 236.00 | 2.64 |
Mambajao Clay | 1,418.00 | 15.94 |
Camiguin Clay | 2, 591.00 | 29.12 |
Mountain Soil Undifferentiated | 4, 393.00 | 49.36 |
Total | 8,900.00 | 100.00 |
Source: Comprehensive Land Use Plan of Mambajao
Climate
Mambajao falls under Type II climate characterized by very pronounced rain period during the months of December to February and the absence of a definite dry season (LREP, 1986). Mambajao being on the northeastern part of the island receives an annual rainfall of 2300 millimeters. The estimated gross precipitation is 6.5×10 cubic meter. This also replenishes the watershed areas of Mambajao, generally found in four (4) upland barangays. Rainfall in Mambajao is greatly influenced by the seasonal occurrence of northeast and southwest monsoon. The months of April and May have the least rainfall. While the months of December to February, more amount of rainfall occurs in the lower portion than on the higher parts of the municipality, as a result of maritime air masses by the Northeast monsoon and the north trade winds coming from the northeast and eastern directions.
Like the rest of the island province, Mambajao has a mean annual temperature of twenty five degrees centigrade (25°C). The hottest months are April to August with average temperature that reaches twenty six degrees centigrade (28°C) and the coldest is September with 22.7 degrees Celsius (LREP, 1986).
The municipality has an average relative humidity of eighty percent (80%). The presence of forest cover along the foot slopes of Mount Hibok-Hibok and its environs affect the relative humidity of the upland barangays. These barangays have higher relative humidity compared to the coastal and lowland barangays.
Wind from the northeast, locally known as “Dumagsa”, usually brings in the dry season. Wind from the Southwest also locally known as “Habagat”, ushers in the wet season. This south-westerly wind has an average speed of four kilometers per hour greatly affecting the fishing activities of the town.
“Satan” is a local name for wind that blows from the southern portion of the town and is characterized by a terrible heat. Like the rest of the province, typhoon normally visits the municipality. It usually occurs during the months of August to December. Gust of strong winds coupled with relentless heavy downpour brings considerable damage to agricultural crops resulting to famine and starvation among farmers.
Climate
Mambajao in general, is an island kissed by fire and water. Fire from the belly of the earth destroyed the idyllic setting when Old Vulcan erupted in 1871 and Mt. Hibok-hibok erupted in 1951. Rains are seasonal occurrences, sometimes due to typhoons, other times due to weather systems like monsoons and cold front. These occurrences have changed the contour of Mambajao. The changing coastlines serve as realities of the rain and wind. Wind and water scour the coastlines and erode the mountains. Mambajao occasionally experienced ground shaking due to tectonic movement.
The has identified a number of climate change hazards that possess threats to create havoc, namely: landslide, flooding, storm surge & tsunami and volcanic
Landslide
Landslide can be caused by continuous heavy rains. It has two categories, the high and moderate susceptibilities. All barangays except Kuguita are highly susceptible to landslide covering a total area of 5,527.16 hectares with 210 households while a total of 4,352.20 hectares with 5,485 households are moderately susceptible to landslide.
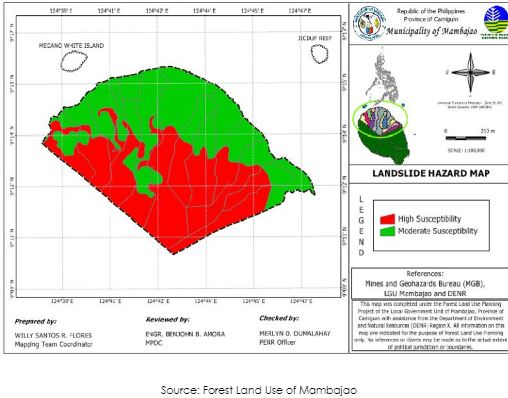
Table 11. Result of Landslide Hazard Assessment
Barangay Name | High Susceptibility to Landslide | Moderate Susceptibility to Landslide | ||
Area (Has.) | No. of Households | Area (Has.) | No. of Households | |
Agoho | 95.19 | 342.56 | 458 | |
Anito | 237.6 | 26 | 283.43 | 315 |
Balbagon | 0.06 | 332.16 | 343 | |
Baylao | 348.8 | 6 | 615.43 | 502 |
Benhaan | 208.28 | 13 | 143.23 | 136 |
Bug-ong | 43.05 | 1 | 157.37 | 250 |
Kuguita | 160.42 | 236 | ||
Magting | 409.31 | 20 | 192.44 | 238 |
Naasag | 298.61 | 43 | 201.43 | 216 |
Pandan | 330.95 | 33 | 235.4 | 320 |
Poblacion | 884.8 | 45 | 742.24 | 1330 |
Soro-soro | 427.82 | 7 | 210.1 | 176 |
Tagdo | 406.88 | 212.42 | 180 | |
Tupsan | 466.16 | 10 | 291.64 | 405 |
Yumbing | 369.65 | 6 | 232.03 | 380 |
Grand Total | 4,527.16 | 210 | 4,352.20 | 5,485 |
Source: GIS generated data (Layover of Administrative & Landslide Maps)
Flooding
Flooding on the other hand, is also caused by continuous heavy rains. Top three highly susceptible areas are barangays Baylao, Poblacion and Yumbing with 131.63, 67.88 and 22.58 hectares respectively.
Figure 5 - Geo-Hazard Map (Flooding)
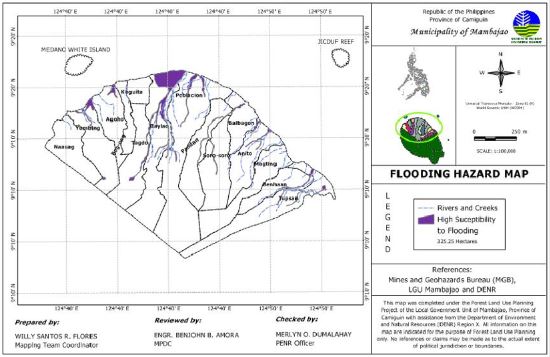
Table 12. Result of Flooding Hazard Assessment
Barangay Name | High Susceptible to Flooding | Barangay Name | High Susceptible to Flooding | ||
Area (Has.) | Number of Households | Area (Has.) | Number of Households | ||
Agoho | 14.45 | 65 | Naasag | – | – |
Anito | 15.88 | 16 | Pandan | 12.33 | 9 |
Balbagon | 6.83 | 5 | Poblacion | 67.88 | 204 |
Baylao | 131.63 | 165 | Soro-soro | 7.62 | – |
Benhaan | 8.5 | 15 | Tagdo | 15.6 | – |
Bug-ong | 0.03 | – | Tupsan | 21.92 | 46 |
Kuguita | – | – | Yumbing | 22.58 | 144 |
Magting | – | – | Total | 325.25 | 669 |
Source: GIS generated data (Layover of Administrative & Flooding Maps)
Volcanic
As a volcanic island, the municipality prepares for storm surge and tsunami consequences. Mambajao has eleven (11) coastal barangays namely: Tupsan, Magting, Anito, Balbagon, Poblacion, Baylao, Kuguita, Bug-ong, Agoho, Yumbing and Naasag. People living along the coastal line of these barangays will be greatly affected during storm surge and tsunami.
Camiguin Island is composed of fourteen (14) volcanoes scattered around the island’s five (5) municipalities. Volcanic eruption is the most feared hazard
in Mambajao. Strict implementation of issuance of building permit and zoning certification is being followed and the early warning signs that the MDRRMC needs to watch out for is the alert warning given by the PhilVolcs. Based on the map, all barangays of the municipality is within the danger zone for volcanic eruption covering a total of 7,290.89 hectares or 82.12%.
Figure 6: Geo - Hazard Map (Volcanic Hazard)
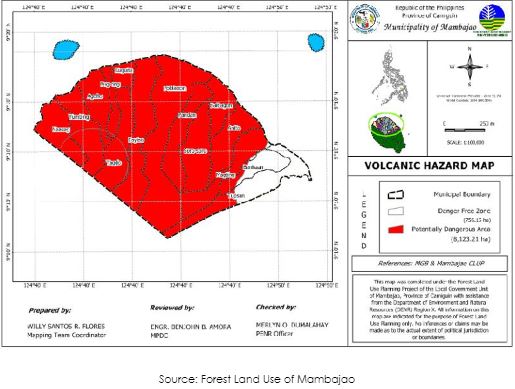
Table 13: Result of Volcanic Hazard Assessment
Barangay | Danger Free Zone (In Has.) | Potentially Dangerous Zone (In Has.) | Total |
Agoho | 43.61 | 394.13 | 437.74 |
Anito | 521.03 | 521.03 | |
Balbagon | 332.22 | 332.22 | |
Baylao | 2.51 | 961.71 | 964.22 |
Benhaan | 250.9 | 100.6 | 351.5 |
Bug-ong | 7.48 | 192.45 | 199.93 |
Kuguita | 160.42 | 160.42 | |
Magting | 13.2 | 588.55 | 601.75 |
Naasag | 135.95 | 364.09 | 500.04 |
Pandan | 566.35 | 566.35 | |
Poblacion | 1627.02 | 1628.02 | |
Soro-soro | 637.92 | 637.92 | |
Tagdo | 341.28 | 278.01 | 619.29 |
Tupsan | 491.54 | 265.71 | 757.25 |
Yumbing | 301 | 300.68 | 601.68 |
Grand Total | 1587.47 | 7290.89 | 8879.36 |
% | 17.88 | 82.12 | 100.00 |
Source: GIS generated data (Layover of Administrative & Volcanic Hazard Maps)
Storm Surge/Tsunami
Mambajao is not spared from storm surges due to the winds coming from the north and tsunami threats considering the presence of two (2) earthquake generators: East Bohol Fault and Surigao-Butuan Fault.
Figure 7 - Geo-Hazard Map (Storm Surge/Tsunami)
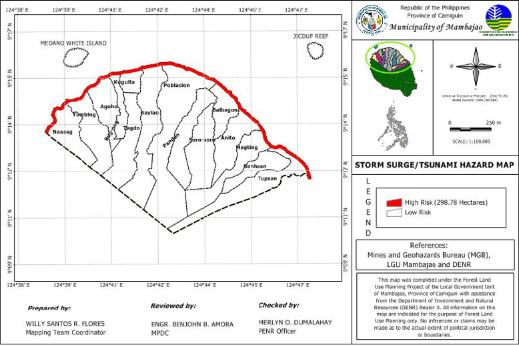
Table 14 – Result of Storm Surge/Tsunami Susceptibility Assessment
Barangay | High Susceptibility (Area in Hectares) |
Agoho | 23.34 |
Anito | 27.83 |
Balbagon | 29.14 |
Baylao | 17.73 |
Benhaan | |
Bug-ong | 10.41 |
Kuguita | 17.66 |
Magting | 16.49 |
Naasag | 35.18 |
Pandan | |
Poblacion | 50.07 |
Soro-soro | |
Tagdo | |
Tupsan | 45.84 |
Yumbing | 23.04 |
Total | 296.73 |
Source: GIS generated data (Layover of Administrative & Storm Surge/Tsunami Maps)